Simply tracking cryptoasset investment performance & buy signals via Google Sheet (2/2)

2 months ago, I first published my Google Sheet that I use to track cryptoasset investments. I have been working on it to refine it and add a few tools for spotting mid-term investment signals. With this new post, I’d like to introduce my updated sheet that can hopefully help you make better crypto investment decisions.
-> You can find my updated Crypto Investment Tracking Sheet here.

For an instruction how to use this sheet please refer to my last post.
There are a few things that I want to emphasize when looking at the charts.
- Back up your price analyses with a fundamental understanding of the cryptoassets that you’re investing in. There are the first approaches for cryptoasset valuations. Try to understand them and combine fundamental analysis with chart analysis for smart investments.
- Portfolio diversification is important. Make sure to set a goal allocation for your various cryptoassets and try to get closer to the target levels through your trades & investments.
- Realize that different cryptoassets have different risk profiles. Beginners should stick with BTC, ETH, and LTC. If volatility scares you stick to the ones that have been around the longest and add a few uncorrelated or even negatively correlated assets to your portfolio to decrease beta.
- Don’t suffer death by information overkill. Choose the signals that you understand and that you want to track. Stick to them.
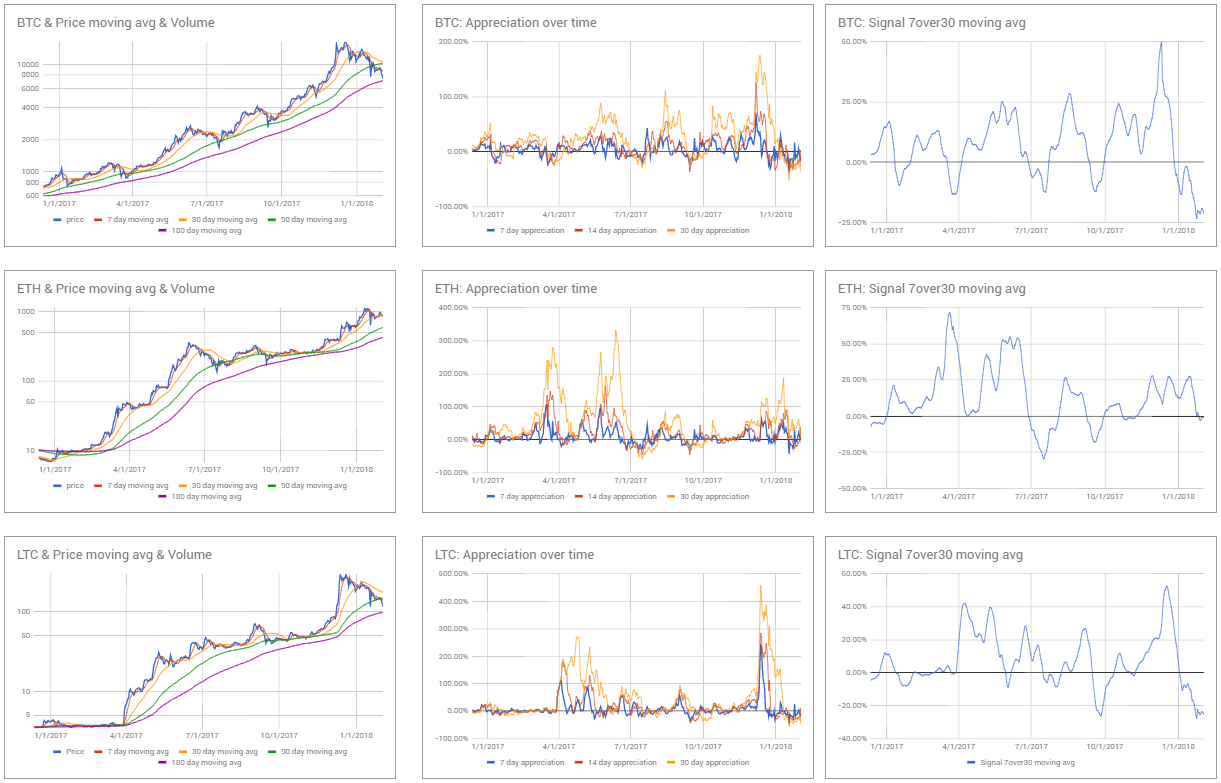
- There is a difference in linear vs. logarithmic scales. For cryptoassets that can grow exponentially for some time periods, logarithmic scales can be useful to compare percent price changes over time.
- Make yourself familiar with a simple moving average crossover strategy in order to understand short & long term trends as well as momentum.
- Instead of looking at a simple price chart, observe appreciation over time to estimate whether a certain asset has been too long in a bull/bear situation.
- If the percentage difference between a short term and longer term moving average (“Signal 7over30 moving avg” in my chart) becomes larger and stays large for some time, prepare to buy/sell anticyclically.
- Realize your profits (or losses for income shifting & tax reasons).
- Stick to your rules and don’t become emotional when markets move.

If you think this was useful please share your love with a tweet or a like on Medium. Of course, I’d also be happy with a small donation (BTC: 18APi2Nk1p5L7iEmJM7aG5h6GUqxvWEUS7 & ETH: 0x0356fd48514D2EE84B13f06D741B62DEed351e23) :)
Subscribe to my Refind if you want to stay up to date with interesting articles & resources I find in this space.
About the author Ha Duong: I am an Investment Manager at Project A Ventures, a venture capital company based in Berlin. I’m excited about the economical as well as the societal possibilities that blockchain technology brings with it.